Refine Your Search

Search Results

Viewing 1 to 20 of 20
Technical Paper

Pycrash: An Open-Source Tool for Accident Reconstruction

2021-04-06
2021-01-0896
Accident reconstructionists routinely rely on computer software to perform analyses. While there are a variety of software packages available to accident reconstructionists, many rely on custom spreadsheet-based applications for their analyses. Purchased packages provide an improved interface and the ability to produce sophisticated animations of vehicle motion but can be cost prohibitive. Pycrash is a free, open-source Python-based software package that, in its current state, can perform basic accident reconstruction calculations, automate data analyses, simulate single vehicle motion and, perform impulse-momentum based analyses of vehicle collisions. In this paper, the current capabilities of Pycrash are illustrated and its accuracy is assessed using matching PC-Crash simulations performed using PC-Crash.
Journal Article

Pedestrian Impact Analysis of Side-Swipe and Minor Overlap Conditions

2021-04-06
2021-01-0881
This paper presents analyses of 21real-world pedestrian versus vehicle collisions that were video recorded from vehicle dash mounted cameras or surveillance cameras. These pedestrian collisions have in common an impact configuration where the pedestrian was at the side of the vehicle, or with a minimal overlap at the front corner of the vehicle (less than one foot overlap). These impacts would not be considered frontal impacts [1], and as a result determining the speed of the vehicle by existing methods that incorporate the pedestrian travel distance post impact, or by assessing vehicle damage, would not be applicable. This research examined the specific interaction of non-frontal, side-impact, and minimal overlap pedestrian impact configurations to assess the relationship between the speed of the vehicle at impact, the motion of the pedestrian before and after impact, and the associated post impact travel distances.
Technical Paper

Speed Analysis from Video: A Method for Determining a Range in the Calculations

2021-04-06
2021-01-0887
This paper introduces a method for calculating vehicle speed and uncertainty range in speed from video footage. The method considers uncertainty in two areas; the uncertainty in locating the vehicle’s position and the uncertainty in time interval between them. An abacus style timing light was built to determine the frame time and uncertainty of time between frames of three different cameras. The first camera had a constant frame rate, the second camera had minor frame rate variability and the third had more significant frame rate variability. Video of an instrumented vehicle traveling at different, but known, speeds was recorded by all three cameras. Photogrammetry was conducted to determine a best fit for the vehicle positions. Deviation from that best fit position that still produced an acceptable range was also explored. Video metadata reported by iNPUT-ACE and Mediainfo was incorporated into the study.
Journal Article

Acceleration of Left Turning Heavy Trucks

2020-04-14
2020-01-0882
Accidents involving heavy trucks turning left across travel lanes of a roadway are common subjects of investigation in the field of accident reconstruction. The distance traversed during a turn and lateral and tangential accelerations of the left turning heavy truck can be used to model its motion and determine timing as it relates to a collision. As a follow up to the 2019 SAE Accident Reconstruction section paper by the authors (2019-01-0411), this paper will investigate the longitudinal and lateral accelerations of heavy trucks during small, medium, and large radius turns and analyze peak and average lateral accelerations as they relate to turn radius and vehicle speeds. This study analyzed 70 tractor-trailers, 19 straight trucks and 15 bobtail tractors for a total of 104 heavy trucks.
Technical Paper

Reconstruction of 3D Accident Sites Using USGS LiDAR, Aerial Images, and Photogrammetry

2019-04-02
2019-01-0423
The accident reconstruction community has previously relied upon photographs and site visits to recreate a scene. This method is difficult in instances where the site has changed or is not accessible. In 2017 the United States Geological Survey (USGS) released historical 3D point clouds (LiDAR) allowing for access to digital 3D data without visiting the site. This offers many unique benefits to the reconstruction community including: safety, budget, time, and historical preservation. This paper presents a methodology for collecting this data and using it in conjunction with aerial imagery, and camera matching photogrammetry to create 3D computer models of the scene without a site visit.
Technical Paper

Two Phase Heavy Truck Acceleration Model

2019-04-02
2019-01-0411
There have been several papers published over the past 25 years regarding the acceleration of heavy trucks, including different loading conditions, drivetrain configurations, and driving techniques. The papers provide a large data set that measures the speed, distance, and time of the vehicles during acceleration testing and present the data in tabular or graphical formats. Although the data as presented can be useful, it can be challenging to pore over all the data to determine the correct set for a specific application in accident reconstruction. As of this paper’s date of publication, there are approximately eight relevant papers with a total of 268 acceleration tests performed, spanning many years. This paper reviews all the available published literature and summarizes the relevant data in a comprehensive list of accelerations for different heavy truck configurations, which provides a valuable resource to the accident reconstruction field.
Technical Paper

Low Speed Override of Passenger Vehicles with Heavy Trucks

2019-04-02
2019-01-0430
In low speed collisions (under 15 mph) that involve a heavy truck impacting the rear of a passenger vehicle, it is likely that the front bumper of the heavy truck will override the rear bumper beam of the passenger vehicle, creating an override/underride impact configuration. There is limited data available for study when attempting to quantify vehicle damage and crash dynamics in low-speed override/underride impacts. Low speed impact tests were conducted to provide new data for passenger vehicle dynamics and damage assessment for low speed override/underride rear impacts to passenger vehicles. Three tests were conducted, with a tractor-trailer impacting three different passenger vehicles at 5 mph and 10 mph. This paper presents data from these three tests in order to expand the available data set for low speed override/underride collisions.
Technical Paper

Lateral and Tangential Accelerations of Left Turning Vehicles from Naturalistic Observations

2019-04-02
2019-01-0421
When reconstructing collisions involving left turning vehicles at intersections, accident reconstructionists are often required to determine the relative timing and spacing between two vehicles involved in such a collision. This time-space analysis frequently involves determining or prescribing a path and acceleration profile for the left turning vehicle. Although numerous studies have examined the straight-line acceleration of vehicles, only two studies have presented the tangential and lateral acceleration of left turning vehicles. This paper expands on the results of those limited studies and presents a methodology to automatically detect and track vehicles in a video file. The authors made observations of left turning vehicles at three intersections. Each intersection incorporated permissive green turn phases for left turning vehicles.
Book

Motorcycle Accident Reconstruction

2018-12-10
In a recent National Highway Traffic Safety Administration (NHTSA) report, about one out of every 7 fatalities on the road involved a motorcycle. Itis clear that motorcyclists are more vulnerable and much more likely to be injured or killed in a crash than are passengers in a car accident. Motorcycle Accident Reconstruction purposefully pulls together as much of the relevant accident reconstruction literature and science as possible to present definitive literature that meets the needs of the crash reconstruction industry. The reader will learn to analyze physical evidence, understand what it means, and how to incorporate math and physics into an investigation. Topics featured in this book include: Case studies utilizing event data recorder data Photogrammetry analysis Determining motorcycle speed at the time of an accident The book provides a unique roadmap for the motorcycle accident reconstructionist user.
Book

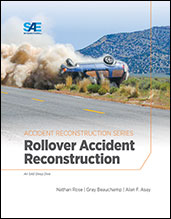
Rollover Accident Reconstruction

2018-08-07
According to the National Highway Traffic Safety Administration, “of the nearly 9.1 million passenger car, SUV, pickup and van crashes in 2010, only 2.1% involved a rollover. However, rollovers accounted for nearly 35% of all deaths from passenger vehicle crashes. In 2010 alone, more than 7,600 people died in rollover crashes.” Rollover accidents continue to be a leading contributor of vehicle deaths. While this continues to be true, it is pertinent to understand the entire crash process. Each stage of the accident provides valuable insight into the application of reconstruction methodologies. Rollover Accident Reconstruction focuses on tripped, single vehicle rollover crashes that terminate without striking a fixed object.
Journal Article

Using Multiple Photographs and USGS LiDAR to Improve Photogrammetric Accuracy

2018-04-03
2018-01-0516
The accident reconstruction community relies on photogrammetry for taking measurements from photographs. Camera matching, a close-range photogrammetry method, is a particularly useful tool for locating accident scene evidence after time has passed and the evidence is no longer physically visible. In this method, objects within the accident scene that have remained unchanged are used as a reference for locating evidence that is no longer physically available at the scene such as tire marks, gouge marks, and vehicle points of rest. Roadway lines, edges of pavement, sidewalks, signs, posts, buildings, and other structures are recognizable scene features that if unchanged between the time of accident and time of analysis are beneficial to the photogrammetric process. In instances where these scene features are limited or do not exist, achieving accurate photogrammetric solutions can be challenging.
Technical Paper

An Analytical Review and Extension of Two Decades of Research Related to PC-Crash Simulation Software

2018-04-03
2018-01-0523
PC-Crash is a vehicular accident simulation software that is widely used by the accident reconstruction community. The goal of this article is to review the prior literature that has addressed the capabilities of PC-Crash and its accuracy and reliability for various applications (planar collisions, rollovers, and human motion). In addition, this article aims to add additional analysis of the capabilities of PC-Crash for simulating planar collisions and rollovers. Simulation analysis of five planar collisions originally reported and analyzed by Bailey [2000] are reexamined. For all five of these collisions, simulations were obtained with the actual impact speeds that exhibited excellent visual agreement with the physical evidence. These simulations demonstrate that, for each case, the PC-Crash software had the ability to generate a simulation that matched the actual impact speeds and the known physical evidence.
Technical Paper

Comparing A Timed Exposure Methodology to the Nighttime Recognition Responses from SHRP-2 Naturalistic Drivers

2017-03-28
2017-01-1366
Collision statistics show that more than half of all pedestrian fatalities caused by vehicles occur at night. The recognition of objects at night is a crucial component in driver responses and in preventing nighttime pedestrian accidents. To investigate the root cause of this fact pattern, Richard Blackwell conducted a series of experiments in the 1950s through 1970s to evaluate whether restricted viewing time can be used as a surrogate for the imperfect information available to drivers at night. The authors build on these findings and incorporate the responses of drivers to objects in the road at night found in the SHRP-2 naturalistic database. A closed road outdoor study and an indoor study were conducted using an automatic shutter system to limit observation time to approximately ¼ of a second. Results from these limited exposure time studies showed a positive correlation to naturalistic responses, providing a validation of the time-limited exposure technique.
Technical Paper

Video Analysis of Motorcycle and Rider Dynamics During High-Side Falls

2017-03-28
2017-01-1413
This paper investigates the dynamics of four motorcycle crashes that occurred on or near a curve (Edwards Corner) on a section of the Mulholland Highway called “The Snake.” This section of highway is located in the Santa Monica Mountains of California. All four accidents were captured on video and they each involved a high-side fall of the motorcycle and rider. This article reports a technical description and analysis of these videos in which the motion of the motorcycles and riders is quantified. To aid in the analysis, the authors mapped Edwards Corner using both a Sokkia total station and a Faro laser scanner. This mapping data enabled analysis of the videos to determine the initial speed of the motorcycles, to identify where in the curve particular rider actions occurred, to quantify the motion of the motorcycles and riders, and to characterize the roadway radius and superelevation throughout the curve.
Technical Paper

A Compendium of Passenger Vehicle Event Data Recorder Literature and Analysis of Validation Studies

2016-04-05
2016-01-1497
This paper presents a comprehensive literature review of original equipment event data recorders (EDR) installed in passenger vehicles, as well as a summary of results from the instrumented validation studies. The authors compiled 187 peer-reviewed studies, textbooks, legal opinions, governmental rulemaking policies, industry publications and presentations pertaining to event data recorders. Of the 187 total references, there were 64 that contained testing data. The authors conducted a validation analysis using data from 27 papers that presented both the EDR and corresponding independent instrumentation values for: Vehicle velocity change (ΔV) Pre-Crash vehicle speed The combined results from these studies highlight unique observations of EDR system testing and demonstrate the observed performance of original equipment event data recorders in passenger vehicles.
Technical Paper

A Survey of Multi-View Photogrammetry Software for Documenting Vehicle Crush

2016-04-05
2016-01-1475
Video and photo based photogrammetry software has many applications in the accident reconstruction community including documentation of vehicles and scene evidence. Photogrammetry software has developed in its ease of use, cost, and effectiveness in determining three dimensional data points from two dimensional photographs. Contemporary photogrammetry software packages offer an automated solution capable of generating dense point clouds with millions of 3D data points from multiple images. While alternative modern documentation methods exist, including LiDAR technologies such as 3D scanning, which provide the ability to collect millions of highly accurate points in just a few minutes, the appeal of automated photogrammetry software as a tool for collecting dimensional data is the minimal equipment, equipment costs and ease of use.
Journal Article

The Relationship Between Tire Mark Striations and Tire Forces

2016-04-05
2016-01-1479
Tire mark striations are discussed often in the literature pertaining to accident reconstruction. The discussions in the literature contain many consistencies, but also contain disagreements. In this article, the literature is first summarized, and then the differences in the mechanism in which striations are deposited and interpretation of this evidence are explored. In previous work, it was demonstrated that the specific characteristics of tire mark striations offer a glimpse into the steering and driving actions of the driver. An equation was developed that relates longitudinal tire slip (braking) to the angle of tire mark striations [1]. The longitudinal slip equation was derived from the classic equation for tire slip and also geometrically. In this study, the equation for longitudinal slip is re-derived from equations that model tire forces.
Technical Paper

Using Data from a DriveCam Event Recorder to Reconstruct a Vehicle-to-Vehicle Impact

2013-04-08
2013-01-0778
This paper reports a method for analyzing data from a DriveCam unit to determine impact speeds and velocity changes in vehicle-to-vehicle impacts. A DriveCam unit is an aftermarket, in-vehicle, event-triggered video and data recorder. When the unit senses accelerations over a preset threshold, an event is triggered and the unit records video from two camera views, accelerations along three directions, and the vehicle speed with a GPS sensor. In conducting the research reported in this paper, the authors ran four front-to-rear crash tests with two DriveCam equipped vehicles. For each test, the front of the bullet vehicle impacted the rear of the stationary target vehicle. Each of the test vehicles was impacted in the rear twice - once at a speed of around 10 mph and again at a speed around 25 mph. The accuracy of the DriveCam acceleration data was assessed by comparing it to the data from other in-vehicle instrumentation.
Technical Paper

Video Projection Mapping Photogrammetry through Video Tracking

2013-04-08
2013-01-0788
This paper examines a method for generating a scaled three-dimensional computer model of an accident scene from video footage. This method, which combines the previously published methods of video tracking and camera projection, includes automated mapping of physical evidence through rectification of each frame. Video Tracking is a photogrammetric technique for obtaining three-dimensional data from a scene using video and was described in a 2004 publication titled, “A Video Tracking Photogrammetry Technique to Survey Roadways for Accident Reconstruction” (SAE 2004-01-1221).
Technical Paper

Comparison of Calculated Speeds for a Yawing and Braking Vehicle to Full-Scale Vehicle Tests

2012-04-16
2012-01-0620
Accurately reconstructing the speed of a yawing and braking vehicle requires an estimate of the varying rates at which the vehicle decelerated. This paper explores the accuracy of several approaches to making this calculation. The first approach uses the Bakker-Nyborg-Pacejka (BNP) tire force model in conjunction with the Nicolas-Comstock-Brach (NCB) combined tire force equations to calculate a yawing and braking vehicle's deceleration rate. Application of this model in a crash reconstruction context will typically require the use of generic tire model parameters, and so, the research in this paper explored the accuracy of using such generic parameters. The paper then examines a simpler equation for calculating a yawing and braking vehicle's deceleration rate which was proposed by Martinez and Schlueter in a 1996 paper. It is demonstrated that this equation exhibits physically unrealistic behavior that precludes it from being used to accurately determine a vehicle's deceleration rate.
X