Refine Your Search

Search Results

Viewing 1 to 10 of 10
Journal Article

Self-Regulation Minimizes Crash Risk from Attentional Effects of Cognitive Load during Auditory-Vocal Tasks

2014-04-01
2014-01-0448
This study reanalyzes the data from a recent experimental report from the University of Utah investigating the effect on driving performance of auditory-vocal secondary tasks (such as cell phone and passenger conversations, speech-to-text, and a complex artificial cognitive task). The current objective is to estimate the relative risk of crashes associated with such auditory-vocal tasks. Contrary to the Utah study's assumption of an increase in crash risk from the attentional effects of cognitive load, a deeper analysis of the Utah data shows that driver self-regulation provides an effective countermeasure that offsets possible increases in crash risk. For example, drivers self-regulated their following distances to compensate for the slight increases in brake response time while performing auditory-vocal tasks. This new finding is supported by naturalistic driving data showing that cell phone conversation does not increase crash risk above that of normal baseline driving.
Journal Article

An Unbiased Estimate of the Relative Crash Risk of Cell Phone Conversation while Driving an Automobile

2014-04-01
2014-01-0446
A key aim of research into cell phone tasks is to obtain an unbiased estimate of their relative risk (RR) for crashes. This paper re-examines five RR estimates of cell phone conversation in automobiles. The Toronto and Australian studies estimated an RR near 4, but used subjective estimates of driving and crash times. The OnStar, 100-Car, and a recent naturalistic study used objective measures of driving and crash times and estimated an RR near 1, not 4 - a major discrepancy. Analysis of data from GPS trip studies shows that people were in the car only 20% of the time on any given prior day at the same clock time they were in the car on a later day. Hence, the Toronto estimate of driving time during control windows must be reduced from 10 to 2 min.
Journal Article

Event Detection: The Second Dimension of Driver Performance for Visual-Manual Tasks

2012-04-16
2012-01-0964
A principal component analysis of the test track data from the Crash Avoidance Metrics Partnership Driver Workload Metrics project provided evidence for two major components in distraction during driving. The first was related primarily to driver workload, while the second was related to event detection and response. This result confirms previous test track findings. A new finding was that “mean single glance duration” (the average dwell time of the eye on the display or control needed to perform the task), loaded on the second dimension (associated with event detection and response), rather than the first (associated with driver workload). Hence, the duration of single glances to a secondary task is more important for event detection and response when driving than total eyes-off-road time or number of glances. These findings fit with the role of a single off-road glance immediately before a crash being predictive of crash probability.
Technical Paper

Predicting Relative Crash Risk from the Attentional Effects of the Cognitive Demand of Visual-Manual Secondary Tasks

2017-03-28
2017-01-1384
This proof-of-concept demonstrates a new method to predict the relative crash risk in naturalistic driving that is caused (or prevented) by the effects on attention of visual-manual secondary tasks performed while driving in a track experiment. The method required five steps. (1) Estimate valid relative crash/near-crash risks of visual-manual secondary tasks measured during naturalistic driving. These data were taken from a prior SAE publication of unbiased estimates of the relative crash/near-crash risks of secondary tasks in the 100-Car naturalistic driving study. (2) Calculate the “physical demand” and “cognitive demand” scores for visual-manual secondary tasks performed while driving on a track.
Technical Paper

Removing Biases from Crash Odds Ratio Estimates of Secondary Tasks: A New Analysis of the SHRP 2 Naturalistic Driving Study Data

2017-03-28
2017-01-1380
Dingus and colleagues recently estimated the crash odds ratios (ORs) for secondary tasks in the Strategic Highway Research Program Phase 2 (SHRP 2) naturalistic driving study. Their OR estimate for hand-held cell phone conversation (Talk) was 2.2, with a 95% confidence interval (CI) from 1.6 to 3.1. This Talk OR estimate is above 1, contrary to previous estimates below 1. A replication discovered two upward biases in their analysis methods. First, for video clips with exposure to a particular secondary task, Dingus and colleagues selected clips not only with exposure to that task, but often with concurrent exposure to other secondary tasks. However, for video clips without exposure to that task, Dingus and colleagues selected video clips without other secondary tasks. Hence, the OR estimate was elevated simply because of an imbalanced selection of video clips, not because of risk from a particular secondary task.
Technical Paper

Revised Odds Ratio Estimates of Secondary Tasks: A Re-Analysis of the 100-Car Naturalistic Driving Study Data

2015-04-14
2015-01-1387
This study revises the odds ratios (ORs) of secondary tasks estimated by Virginia Tech Transportation Institute (VTTI), who conducted the 100-Car naturalistic driving study. An independent and objective re-counting and re-analysis of all secondary tasks observed in the 100-Car databases removed misclassification errors and epidemiological biases. The corrected estimates of secondary task crude OR and Population Attributable Risk Percent (PAR%) for crashes and near-crashes vs. a random baseline were substantially lower for almost every secondary task, compared to the VTTI estimates previously reported. These corrected estimates were then adjusted for confounding from demographics, time of day, weekday-weekend, and closeness to junction by employing secondary task counts from a matched baseline from a later VTTI 100-Car analysis. This matched baseline caused most OR estimates to decline even further.
Journal Article

Automated Driving System Safety: Miles for 95% Confidence in “Vision Zero”

2020-04-14
2020-01-1205
Engineering reliability models from RAND, MobilEye, and Volvo concluded that billions of miles of on-road data were required to validate that the real-world fatality rate of an “Automated Driving System-equipped vehicle” (AV) fleet for an improvement over human-driven conventional vehicles (CV). RAND said 5 billion miles for 20%, MobileEye 30 billion for 99.9%, and Volvo 5 billion for 50% improvement. All these models used the Gaussian distribution, which is inaccurate for low crash numbers. The current study proposes a new epidemiologic method and criterion to validate real-world AV data with 95% confidence for zero to ten fatal crashes. The upper confidence limit (UL) of the AV fatal crash rate has to be lower than the CV fatal crash rate with 95% confidence. That criterion is met if the UL of the AV fatal crash incidence rate ratio estimate is below one.
Journal Article

Cognitive Distraction While Driving: A Critical Review of Definitions and Prevalence in Crashes

2012-04-16
2012-01-0967
There is little agreement in the field of driving safety as to how to define cognitive distraction, much less how to measure it. Without a definition and metric, it is impossible to make scientific and engineering progress on determining the extent to which cognitive distraction causes crashes, and ways to mitigate it if it does. We show here that different studies are inconsistent in their definitions of cognitive distraction. For example, some definitions do not include cellular conversation, while others do. Some definitions confound cognitive distraction with visual distraction, or cognitive distraction with cognitive workload. Other studies define cognitive distraction in terms of a state of the driver, and others in terms of tasks that may distract the driver. It is little wonder that some studies find that cognitive distraction is a negligible factor in causing crashes, while others assert that cognitive distraction causes more crashes than drunk driving.
Book

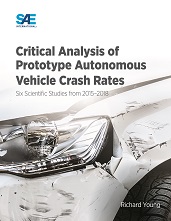
Critical Analysis of Prototype Autonomous Vehicle Crash Rates: Six Scientific Studies from 2015-2018

2021-11-30
Will Automated Vehicles be Safer than Conventional Vehicles? One of the critically important questions that has emerged about advanced technologies in transportation is how to test the actual effects of these advanced systems on safety, particularly how to evaluate the safety of highly automated driving systems. Richard Young's Critical Analysis of Prototype Autonomous Vehicle Crash Rates does a deep dive into these questions by reviewing and then critically analyzing the first six scientific studies of AV crash rates.
X