Refine Your Search

Search Results

Viewing 1 to 15 of 15
Technical Paper

Data Acquisition using Smart Phone Applications

2016-04-05
2016-01-1461
There are numerous publically available smart phone applications designed to track the speed and position of the user. By accessing the phones built in GPS receivers, these applications record the position over time of the phone and report the record on the phone itself, and typically on the application’s website. These applications range in cost from free to a few dollars, with some, that advertise greater functionality, costing significantly higher. This paper examines the reliability of the data reported through these applications, and the potential for these applications to be useful in certain conditions where monitoring and recording vehicle or pedestrian movement is needed. To analyze the reliability of the applications, three of the more popular and widely used tracking programs were downloaded to three different smart phones to represent a good spectrum of operating platforms.
Technical Paper

Post-Impact Dynamics for Vehicles with a High Yaw Velocity

2016-04-05
2016-01-1470
Calculating the speed of a yawing and braked vehicle often requires an estimate of the vehicle deceleration. During a steering induced yaw, the rotational velocity of the vehicle will typically be small enough that it will not make up a significant portion of the vehicle’s energy. However, when a yaw is impact induced and the resulting yaw velocity is high, the rotational component of the vehicle’s kinetic energy can be significant relative to the translational component. In such cases, the rotational velocity can have a meaningful effect on the deceleration, since there is additional energy that needs dissipated and since the vehicle tires can travel a substantially different distance than the vehicle center of gravity. In addition to the effects of rotational energy on the deceleration, high yaw velocities can also cause steering angles to develop at the front tires. This too can affect the deceleration since it will influence the slip angles at the front tires.
Technical Paper

Mid-Range Data Acquisition Units UsingGPS and Accelerometers

2018-04-03
2018-01-0513
In the 2016 SAE publication “Data Acquisition using Smart Phone Applications,” Neale et al., evaluated the accuracy of basic fitness applications in tracking position and elevation using the GPS and accelerometer technology contained within the smart phone itself [1]. This paper further develops the research by evaluating mid-level applications. Mid-level applications are defined as ones that use a phone’s internal accelerometer and record data at 1 Hz or greater. The application can also utilize add-on devices, such as a Bluetooth enabled GPS antenna, which reports at a higher sample rate (10 Hz) than the phone by itself. These mid-level applications are still relatively easy to use, lightweight and affordable [2], [3], [4], but have the potential for higher data sample rates for the accelerometer (due to the software) and GPS signal (due to the hardware). In this paper, Harry’s Lap Timer™ was evaluated as a smart phone mid-level application.
Technical Paper

Comparison of Calculated Speeds for a Yawing and Braking Vehicle to Full-Scale Vehicle Tests

2012-04-16
2012-01-0620
Accurately reconstructing the speed of a yawing and braking vehicle requires an estimate of the varying rates at which the vehicle decelerated. This paper explores the accuracy of several approaches to making this calculation. The first approach uses the Bakker-Nyborg-Pacejka (BNP) tire force model in conjunction with the Nicolas-Comstock-Brach (NCB) combined tire force equations to calculate a yawing and braking vehicle's deceleration rate. Application of this model in a crash reconstruction context will typically require the use of generic tire model parameters, and so, the research in this paper explored the accuracy of using such generic parameters. The paper then examines a simpler equation for calculating a yawing and braking vehicle's deceleration rate which was proposed by Martinez and Schlueter in a 1996 paper. It is demonstrated that this equation exhibits physically unrealistic behavior that precludes it from being used to accurately determine a vehicle's deceleration rate.
Technical Paper

Evaluation of Photometric Data Files for Use in Headlamp Light Distribution

2010-04-12
2010-01-0292
Computer simulation of nighttime lighting in urban environments can be complex due to the myriad of light sources present (e.g., street lamps, building lights, signage, and vehicle headlamps). In these areas, vehicle headlamps can make a significant contribution to the lighting environment 1 , 2 . This contribution may need to be incorporated into a lighting simulation to accurately calculate overall light levels and to represent how the light affects the experience and quality of the environment. Within a lighting simulation, photometric files, such as the photometric standard light data file format, are often used to simulate light sources such as street lamps and exterior building lights in nighttime environments. This paper examines the validity of using these same photometric file types for the simulation of vehicle headlamps by comparing the light distribution from actual vehicle headlamps to photometric files of these same headlamps.
Journal Article

A Comparison of 25 High Speed Tire Disablements Involving Full and Partial Tread Separations

2013-04-08
2013-01-0776
Tire tread separation events, a category of tire disablements, can be sub-categorized into two main types of separations. These include full tread separations, in which the tread around the entire circumference of the tire separates from the tire carcass, and partial tread separations, in which a portion of the tread separates and the flap remains attached to the tire for an extended period of time. In either case, the tire can remain inflated or lose air. Relatively, there have been few partial tire tread separation tests presented in the literature compared to full tread separation tests. In this study, the results of 25 full and partial tire tread separation tests, conducted with a variety of vehicles at highway speeds, are reported. Cases in which the tire remains inflated and loses air pressure are both considered. The testing was performed on a straight section of road and primarily focused on rear tire disablements.
Journal Article

Speed Analysis of Yawing Passenger Vehicles Following a Tire Tread Detachment

2019-04-02
2019-01-0418
This paper presents yaw testing of vehicles with tread removed from tires at various locations. A 2004 Chevrolet Malibu and a 2003 Ford Expedition were included in the test series. The vehicles were accelerated up to speed and a large steering input was made to induce yaw. Speed at the beginning of the tire mark evidence varied between 33 mph and 73 mph. Both vehicles were instrumented to record over the ground speed, steering angle, yaw angle and in some tests, wheel speeds. The tire marks on the roadway were surveyed and photographed. The Critical Speed Formula has long been used by accident reconstructionists for estimating a vehicle’s speed at the beginning of yaw tire marks. The method has been validated by previous researchers to calculate the speed of a vehicle with four intact tires. This research extends the Critical Speed Formula to include yawing vehicles following a tread detachment event.
Journal Article

The Relationship Between Tire Mark Striations and Tire Forces

2016-04-05
2016-01-1479
Tire mark striations are discussed often in the literature pertaining to accident reconstruction. The discussions in the literature contain many consistencies, but also contain disagreements. In this article, the literature is first summarized, and then the differences in the mechanism in which striations are deposited and interpretation of this evidence are explored. In previous work, it was demonstrated that the specific characteristics of tire mark striations offer a glimpse into the steering and driving actions of the driver. An equation was developed that relates longitudinal tire slip (braking) to the angle of tire mark striations [1]. The longitudinal slip equation was derived from the classic equation for tire slip and also geometrically. In this study, the equation for longitudinal slip is re-derived from equations that model tire forces.
Technical Paper

Speed Analysis from Video: A Method for Determining a Range in the Calculations

2021-04-06
2021-01-0887
This paper introduces a method for calculating vehicle speed and uncertainty range in speed from video footage. The method considers uncertainty in two areas; the uncertainty in locating the vehicle’s position and the uncertainty in time interval between them. An abacus style timing light was built to determine the frame time and uncertainty of time between frames of three different cameras. The first camera had a constant frame rate, the second camera had minor frame rate variability and the third had more significant frame rate variability. Video of an instrumented vehicle traveling at different, but known, speeds was recorded by all three cameras. Photogrammetry was conducted to determine a best fit for the vehicle positions. Deviation from that best fit position that still produced an acceptable range was also explored. Video metadata reported by iNPUT-ACE and Mediainfo was incorporated into the study.
Technical Paper

Low Speed Override of Passenger Vehicles with Heavy Trucks

2019-04-02
2019-01-0430
In low speed collisions (under 15 mph) that involve a heavy truck impacting the rear of a passenger vehicle, it is likely that the front bumper of the heavy truck will override the rear bumper beam of the passenger vehicle, creating an override/underride impact configuration. There is limited data available for study when attempting to quantify vehicle damage and crash dynamics in low-speed override/underride impacts. Low speed impact tests were conducted to provide new data for passenger vehicle dynamics and damage assessment for low speed override/underride rear impacts to passenger vehicles. Three tests were conducted, with a tractor-trailer impacting three different passenger vehicles at 5 mph and 10 mph. This paper presents data from these three tests in order to expand the available data set for low speed override/underride collisions.
Technical Paper

An Analytical Review and Extension of Two Decades of Research Related to PC-Crash Simulation Software

2018-04-03
2018-01-0523
PC-Crash is a vehicular accident simulation software that is widely used by the accident reconstruction community. The goal of this article is to review the prior literature that has addressed the capabilities of PC-Crash and its accuracy and reliability for various applications (planar collisions, rollovers, and human motion). In addition, this article aims to add additional analysis of the capabilities of PC-Crash for simulating planar collisions and rollovers. Simulation analysis of five planar collisions originally reported and analyzed by Bailey [2000] are reexamined. For all five of these collisions, simulations were obtained with the actual impact speeds that exhibited excellent visual agreement with the physical evidence. These simulations demonstrate that, for each case, the PC-Crash software had the ability to generate a simulation that matched the actual impact speeds and the known physical evidence.
Book

Rollover Accident Reconstruction

2018-08-07
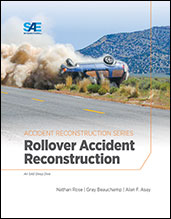
According to the National Highway Traffic Safety Administration, “of the nearly 9.1 million passenger car, SUV, pickup and van crashes in 2010, only 2.1% involved a rollover. However, rollovers accounted for nearly 35% of all deaths from passenger vehicle crashes. In 2010 alone, more than 7,600 people died in rollover crashes.” Rollover accidents continue to be a leading contributor of vehicle deaths. While this continues to be true, it is pertinent to understand the entire crash process. Each stage of the accident provides valuable insight into the application of reconstruction methodologies. Rollover Accident Reconstruction focuses on tripped, single vehicle rollover crashes that terminate without striking a fixed object.
Technical Paper

Braking and Swerving Capabilities of Three-Wheeled Motorcycles

2019-04-02
2019-01-0413
This paper reports testing and analysis of the braking and swerving capabilities of on-road, three-wheeled motorcycles. A three-wheeled vehicle has handling and stability characteristics that differ both from two-wheeled motorcycles and from four-wheeled vehicles. The data reported in this paper will enable accident reconstructionists to consider these different characteristics when analyzing a three-wheeled motorcycle operator’s ability to brake or swerve to avoid a crash. The testing in this study utilized two riders operating two Harley-Davidson Tri-Glide motorcycles with two wheels in the rear and one in the front. Testing was also conducted with ballast to explore the influence of passenger or cargo weight. Numerous studies have documented the braking capabilities of two-wheeled motorcycles with riders of varying skill levels and with a range of braking systems.
Technical Paper

Lateral and Tangential Accelerations of Left Turning Vehicles from Naturalistic Observations

2019-04-02
2019-01-0421
When reconstructing collisions involving left turning vehicles at intersections, accident reconstructionists are often required to determine the relative timing and spacing between two vehicles involved in such a collision. This time-space analysis frequently involves determining or prescribing a path and acceleration profile for the left turning vehicle. Although numerous studies have examined the straight-line acceleration of vehicles, only two studies have presented the tangential and lateral acceleration of left turning vehicles. This paper expands on the results of those limited studies and presents a methodology to automatically detect and track vehicles in a video file. The authors made observations of left turning vehicles at three intersections. Each intersection incorporated permissive green turn phases for left turning vehicles.
Journal Article

Pedestrian Impact Analysis of Side-Swipe and Minor Overlap Conditions

2021-04-06
2021-01-0881
This paper presents analyses of 21real-world pedestrian versus vehicle collisions that were video recorded from vehicle dash mounted cameras or surveillance cameras. These pedestrian collisions have in common an impact configuration where the pedestrian was at the side of the vehicle, or with a minimal overlap at the front corner of the vehicle (less than one foot overlap). These impacts would not be considered frontal impacts [1], and as a result determining the speed of the vehicle by existing methods that incorporate the pedestrian travel distance post impact, or by assessing vehicle damage, would not be applicable. This research examined the specific interaction of non-frontal, side-impact, and minimal overlap pedestrian impact configurations to assess the relationship between the speed of the vehicle at impact, the motion of the pedestrian before and after impact, and the associated post impact travel distances.
X